
Let’s Talk About Sugar
Project Overview
What is the Problem?
The evidence of the negative health impact of these products is clear, particularly with respect to dental health. Sugary drinks are also associated with increased energy intake and, in turn, weight gain and obesity.
Sugary drinks are particularly popular among adolescents.
Obesity is a leading risk factor for type 2 diabetes, heart disease and some cancers.
The World Health Organisation (WHO) released revised guidelines for sugars, recommending that energy from “free sugar” (added by manufacturers, cooks or the consumer) is limited to less than 10% overall. WHO also recommend an upper limit of roughly 25 grams of added sugars per adult per day to remain healthy.
Many countries have already recognised the potential to improve population health by taxing sugary drinks. In recent years, Hungary, Mexico (10% tax), France and Chile have all implemented a tax. The UK announcement in March 2016 follows a similar one by South Africa earlier in that year. The UK sugar levy will come into effect in 2018, with the funds to be used to address childhood obesity.
To read about Mexico’s sugar tax outcomes, click here.
Locally, studies by experts looking at the possible effectiveness of a sugar pricing policy, found that an approach similar to that planned in the United Kingdom or implemented in Mexico would see decreases in added sugar consumption – resulting in small but important declines in the prevalence of obesity of about 0.7% in men and 0.% in women.
This may not sound impressive, but extrapolated over 25 years and the potential becomes clear. Building in the true costs of sugar-drinks would see 4,400 fewer cases of heart disease and 1,100 fewer strokes among Australians. Some 1,600 deaths would be avoided and savings to the national health-care system would add up to A$609 million.
Advocacy Targets
PHAIWA is advocating for a sugar tax to be introduced in Australia.
PHAIWA will continue to strive with partners to reduce the consumption of sugar in Aboriginal communities.
PHAIWA will highlight the tactics used by industry to promote sales and consumption of soft drinks, especially to children.
PHAIWA will continue to work with Aboriginal Environmental Health and Aboriginal Health Workers to reduce the soft drink consumption to ensure they are good role models for their communities.
PHAIWA Projects and Resources
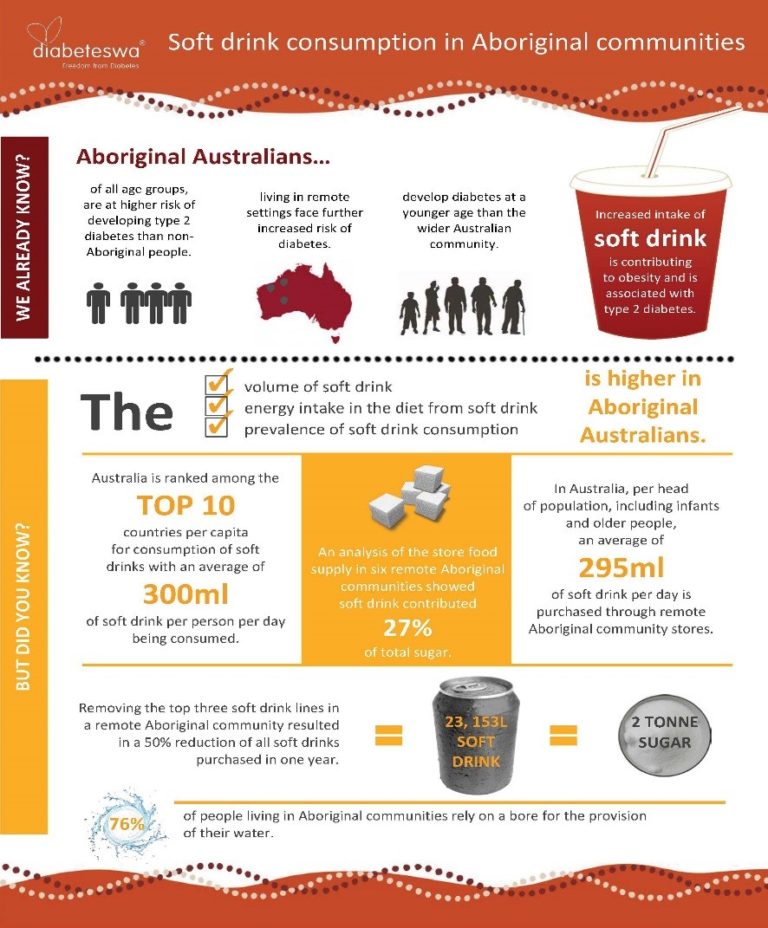
PROJECT ONE – Sugar Consumption in Aboriginal Communities
“I think in remote communities and very remote communities, sugar is just killing the population.”
Nigel Scullion (Indigenous Affairs Minister)
In many remote Aboriginal communities, sugary drink consumption is particularly high. Evidence to Senate Estimates revealed that, in the 2015/16 financial year, remote Aboriginal communities were buying 1.1 million litres of sugary soft drink through community stores.
PHAIWA partnered with Diabetes WA, Nirrumbuk Aboriginal Corporation and AHPA (WA) to increase awareness about the high consumption of soft drink in Aboriginal communities. The project aimed to reduce soft drink consumption through the installation of water fountains and in-store strategies to promote water over soft drink. As part of this trip, the girls worked with the community store managers to identify ways to promote water. Some of the strategies that the store owners plan to implement include: running lunchtime meal deals that have water as the beverage option, dedicating prime shelf space within the stores to water, introducing smaller cans of soft drink, and putting up posters that highlight the health benefits of choosing water instead of soft drink.
Further Reading
Thurber K. Soft drinks / hard evidence: Reducing soft drink intake could have benefits for Indigenous children. The Health Advocate. 2014; June:32–3.*
PROJECT TWO – Sugar Levy Twitter Analysis
Following the announcement of the UK’s intention to implement a sugar levy, PHAIWA commenced a twitter analysis of tweets using sugary terms from the 7/3/16 to 1/4/16. This time frame decision was based on just over one week prior and two weeks post the announcement. The aim of the analysis was to identify:
- Who in Australia is influencing the sugar debate?
- What arguments are they using?
- Who is for or against the sugar tax?
A total of 29 482 tweets were accessed and after exclusions, the total number of tweets analysed was 14553.
PHAIWA broke the tweets into sectors to identify who was saying what. These included:
- Health organisations – NGOs, WHO, advocates
- Experts – health & wellbeing, nutrition, chefs
- Community
- Researchers/Universities
- ‘Healthy’ Industry
- Soft drink industry
- Government
- Media
The CPA framework was then applied to identify and categorise the tweets into the 6 strategies designed to influence policies and public opinion in favour of the industry (Hillman AJ, Keim GD, Schuler D. Corporate political activity: A review and research agenda. J Manage. 2004; 30(6): 837–57).
This project is currently in the analysis phase. For further information please contact Melissa Stoneham atm.stoneham@curtin.edu.au
Publications
PHAIWA regularly writes on the issue of sugar. Some links are below:
Time to take action on soft drink consumption in low- and middle-income countries (Mel Stoneham)
The Olympics – faster, higher, stronger….unhealthier? (Mel Stoneham)
A spoonful of sugar makes the taxes go up! (Mel Stoneham)
Coke really is part of the solution! And not just for obesity … (Mel Stoneham)
Resources
CDC Sugar Sweetened Beverages Reports (February 2017)
CDC has just released two reports on consumption of sugar-sweetened beverages, one for adults and one for children and adolescents.
By way of summary the reports state that for adults ages 20 and over;
- Half drink at least one sugar-sweetened beverage on any given day
- These contribute 145 calories per day or about 6% of total calories
- The amount consumed declines with age.
For kids ages 2 to 19, the report says;
- More than 60% consume at least one a day
- Sugary drinks provide an average of 143 calories a day or 7% of total calories
- Roughly 10% of kids drink 3 or more per day
- Kids ages 12 to 19 drink the most.
The reports are available at:
https://www.cdc.gov/nchs/data/databriefs/db270.pdf (adults)
https://www.cdc.gov/nchs/data/databriefs/db271.pdf (children)
WHO Sugar intake for adults and Children Guideline (2015)
How Much Sugar is in that Drink? (this is a set of photos from CNN that compares the amount of sugar found in some of America’s top selling beverages
Rethink Sugary Drinks is a partnership between the health and community organisations who are concerned about the amount of sugar in soft drinks and sugary drink overconsumption. Visit the website to find a range of resources and facts
Food Politics
Sugar: a roundup of recent industry reports.
Is sugar under siege?
The sugar industry must think so.
Take a look at these recent industry reports:
- International Sugar Organisation: An Evaluation of the Global Sugar Market Environment
- American Sugar Alliance: Sugar Market Outlook
- Sosland Publishing: Consumer Trends and Industry Response
- Mintel: Trends in sugar, sugar reduction, and sweeteners
- Rabobank: Sweetness and Lite: How Vulnerable is Global Sugar Consumption to Food & Beverage Trends?
- The Sugar Association: The New State of Play for Sugar: Trends, Policy, Consumption and Activism
Australia’s Solutions
In this article, it is proposed that a tax on sugary drinks of 40 cents per 100 grams of sugar, on all non-alcoholic, water-based drinks that contain added sugar should be added in an effort to recoup some of the costs of obesity to the community.
The AMA has called for sugar-sweetened drinks should be taxed and obesity renamed a chronic disease.
Examples of what is happening around the globe
Tesco supermarket chain in the UK cuts sugar in own-brand drinks to avoid sugar tax.
Industry responses
Soft drinks industry lobbies government to dilute sugar tax.
This article refers to research which reveals that 55% of all the carbonated drinks on sale in shops from Aldi to Waitrose contain more than 30 grams, or seven teaspoons, of sugar – the limit that everyone over the age of 11 is encouraged to stick to. The research was based in Scotland.
Half of fizzy drinks have more sugar in one can than adult daily limit | Life and style | The Guardian from Obesity Action Scot’sTweet Global heading
Even a developing country like Nuie in the Pacific which has only 1612 people, has included a sugar tax in its budget to try and limit the numbers suffering from diabetes. Read the article here.
This article discusses whether a sugar tax is another nanny state strategy and discusses the age old argument about personal responsibility.
This study found that most sugary canned drinks contain more than the average recommended daily allowance for sugar.
This article discusses how clinicians can start a conversation with their clients about reducing sugary drink consumption.
This article refers to research which shows that children in England consume half their recommended maximum daily intake of sugar at breakfast.
Live Lighter Resources
The Centre for Science in the Public Interest
The Centre for Science in the Public Interest sent out the press release below on 5 January 2017 to announce a lawsuit filed on behalf of the non profit Praxis Project.
The complaint says Coca-Cola and its trade association, the American Beverage Association (ABA), mislead the public when they trash the science linking sugary drinks to obesity, type 2 diabetes, and the like.
It cites the August 2015 account in the New York Times of Coca-Cola’s funding of the Global Energy Balance Network, which aimed to shift attention from poor diets as a cause of obesity to lack of physical exercise. Coca-Cola spent $120 million on research from 2010 to 2015 that could cast doubt on evidence linking health risks to sugary drinks.
It also cites quotations from officials of Coca-Cola and the ABA and researchers they fund “making false and deceptive statements about sugar-sweetened drinks.” For example:
Coca-Cola’s senior vice president, Katie Bayne, claims that “[t]here is no scientific evidence that connects sugary beverages to obesity. “Simply put, it is wrong to say beverages cause disease,” the ABA stated in another release. One of the scientists funded by Coca-Cola, Dr. Steven Blair, stated that “there is really virtually no compelling evidence” that sugar drinks are linked to the obesity epidemic.
The complaint also charges that Coca-Cola paid dietitians to promote sugary drinks; it quotes one dietitian who suggested that an eight-ounce soda could be a healthy snack, like “packs of almonds.”
It will be interesting to see how this lawsuit fares. Stay tuned.
February 2017
CDC has just released two reports on consumption of sugar-sweetened beverages, one for adults and one for children and adolescents.
https://www.cdc.gov/nchs/data/databriefs/db270.pdf (adults)
https://www.cdc.gov/nchs/data/databriefs/db271.pdf (children)
By way of summary the reports state that for adults ages 20 and over:
- Half drink at least one sugar-sweetened beverage on any given day
- These contribute 145 calories per day or about 6% of total calories
- The amount consumed declines with age.
For kids ages 2 to 19, the report says;
- More than 60% consume at least one a day
- Sugary drinks provide an average of 143 calories a day or 7% of total calories
- Roughly 10% of kids drink 3 or more per day
- Kids ages 12 to 19 drink the most.